xrite-export
rust axum tokio
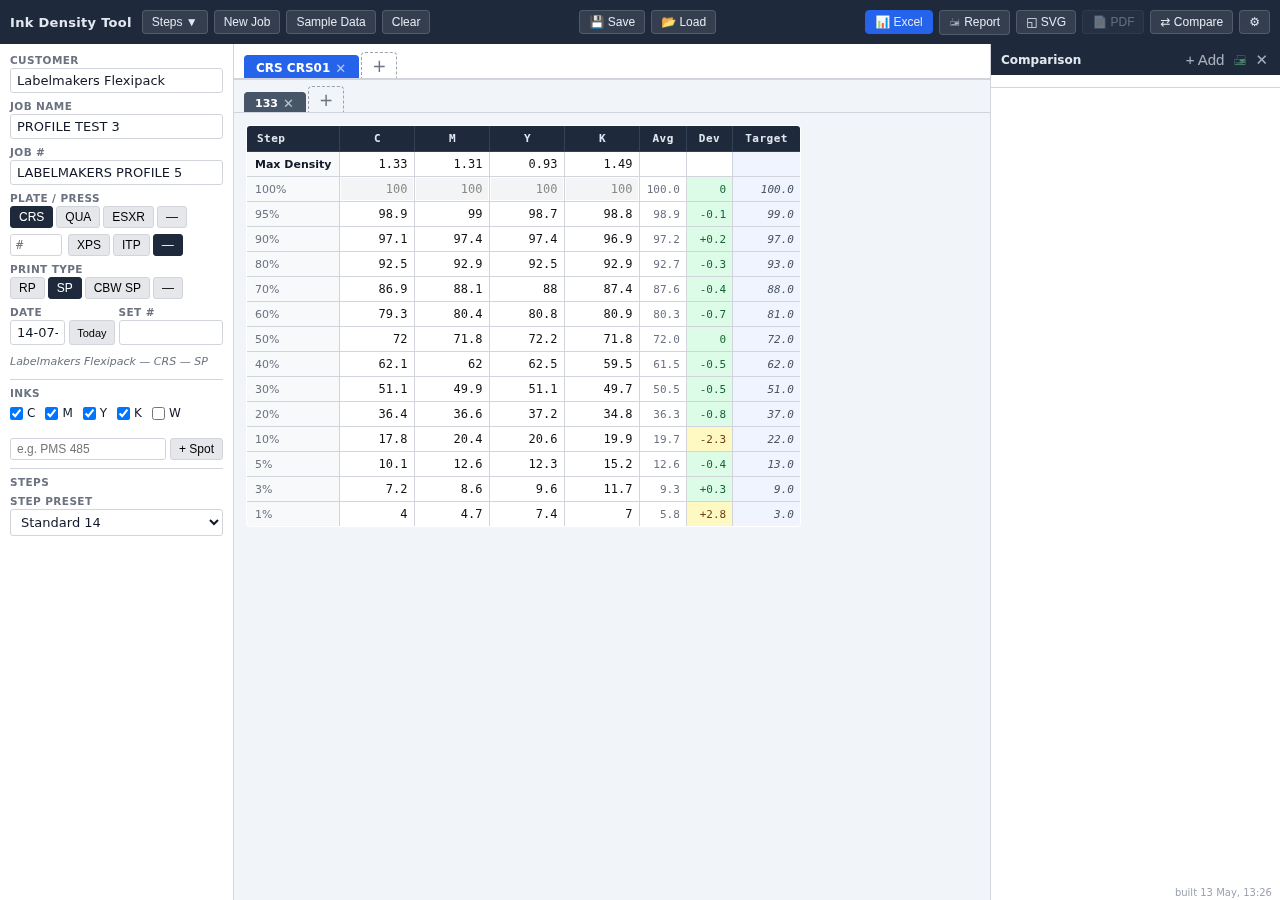
A tool for recording CMYK ink-density readings off an X-Rite eXact spectrodensitometer and turning them straight into a finished report. Before this existed, checking a job meant finding its file on the server, printing it out, scanning a strip of patches and hand-writing every reading onto the print-out, then typing all of that back up and printing it again — for a typical job that's 4 colours across 3 screen rulings and 2 dot shapes, 16 steps each, so somewhere around 385 numbers written down by hand and then typed up a second time. This tool cuts that down to scanning the strip once.
how it works
The spectrodensitometer — a handheld device that measures how dark a printed colour patch is — comes with its own X-Rite software called DataCatcher. Every time you scan a patch, DataCatcher behaves like an invisible extra keyboard: it types the reading straight into whichever box on screen is currently selected, then presses a key (tab, enter, or the down arrow) to jump to the next box automatically. I'd seen the same trick before on a barcode scanner used to type in a password by scanning a barcode instead of typing it out — so I scanned patches into a plain text box and watched which key it pressed and when, until the pattern was clear enough to reverse-engineer. I built this chart's boxes in that exact same order the scanner reads a strip of patches, top to bottom in each column — which means you can scan an entire strip without ever touching the mouse or looking up from the device. When you're done, one click turns all of that into a finished report, in the spots where the numbers are supposed to go — no more manually copying figures across by hand.
built with
Written in Rust — I reach for it on projects like this because it's reliable, stays clean as it grows, and needs far fewer dependencies than something like Python. It started out as three things at once: a desktop program, a browser version, and a small Windows helper that let the browser version talk to Adobe Illustrator directly. The desktop build and that Illustrator/Excel export path have since been dropped — workplace permissions make it hard to install desktop software, so the browser version is what people actually reach for day to day, and its export got rebuilt as a single HTML report that opens anywhere without needing Illustrator or Excel at all. The genuinely tricky part turned out to be the report itself: every job and customer combines a different number of colours, screen rulings, and dot shapes, so getting all of that to lay out correctly took far more care than the actual density-reading logic underneath it, which is fairly simple.
It's in daily use — myself and my coworkers all use it multiple times a day. It's saved real hours that used to go into writing out and retyping the same numbers twice, and probably saved a wrist or two in the process.